Showing posts with label Price action. Show all posts

Monday, March 10, 2008

CONTINUATION PATTERNS

CONTINUATION PATTERNS

Rectangles

Rectangle-bullish in an up trend

When market is flat, draw a line through the highs and a line through the low. Buy when the market closes above the straddle. Sometimes, there will be a bull trap and the market will break back into the rectangle and below the support line.


Rectangles- bearish in a downtrend

Sell when price breaks below support and closes below support.


Ascending Triangles

Ascending Triangles in an uptrend-bullish

A formation in which the slope of price high and the slope of price lows are converging to a point. The resistance line is parallel to the bottom edge of the chart while the support line is upward sloping. Place a buy order on a break up and out of triangles. However, if the pattern fails, sell when the market breaks out below the triangle.


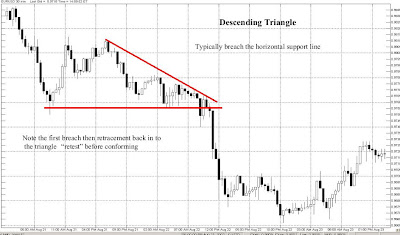
Descending Triangles in a downtrend--bearish

The defining characteristic of descending triangles is the pattern of declining highs and a series of equal lows. This combination of points can be connected to form right angle triangle. The hypotenuse should be sloping from higher to lower and left to right. An illusory double bottom invites one last batch of weak hands to buy and just before a sharp break signals major selling. Sell when price breaks out and down. Descending triangles are amongst the most reliable off all technical pattern because both supply and demand are easily defined.


Symmetrical Triangles

Symmetrical Triangles in an up trend -bullish

A symmetrical triangles is a formation in which the slope of price highs and lows are converging to a point. Support and resistance are sloping. Symmetrical triangles are formed by rallies and sell-offs, each smaller than the last. As time moves on an even is imminent. The move will be explosive. Place a buy order on a brake up and out of triangles but the price could go in the opposite direction.


Symmetrical Triangles in adown trend -bearish

Place a sell order on a breakot below the triangle.


PS: To be Continue...Enjoy all.

Monday, February 25, 2008

Channels

Hi all,


New week :P..sweet movement by geppy now on my chart..Hope you all find this post use full..Big credit to Ngoqs for the great source.


Channels


When prices trend between two parallel trendlines they form a channel. When prices hit the bottom trendline, this may be used a buying area and when prices hit the upper trendline, this may be used as profit taking area and vice versa.

Breakout of trendlines and support and resistance line provide good areas for buying or selling.

Channels can be upward or downward, sloping and horizontal.

Channels can be constructed from Trendlines by connecting two pivot highs or two pivot lows.

Four variations of trendlines are used to construct two variations of parallel channels;

1- connecting 2 rising or ascending pivot highs = Rising or Ascending Tops Trendline to produce Rising or Ascending Parallel Channel

2- connecting 2 falling or descending pivot highs = Falling or Descending Tops Trendline to produce Falling or Descending Parallel Channel


3- connecting 2 rising or ascending pivot lows = Rising or Ascending Bottoms Trendline to produce Rising or Ascending Parallel Channel


4- connecting 2 falling or descending pivot lows = Falling or Descending Bottoms Trendline to produce Falling or Descending Parallel Channel


The trendlines define the top and bottom of a channel which define support and resistance.


Spesial Thx to Ngoqs of Trading Naked

Thursday, February 21, 2008

TrendLines, Support & Resistance Lines

TrendLines, Support & Resistance Lines

Support and Resistance Lines Support and Resistance Lines can be both horizontal and sloping.

Resistance Lines are drawn through previous pivot highs.Resistance acts like a ceiling.Depending on it;s strength, a resistance line can pause an up trend and when cery strong can reverse an up trend.It's strength is determined by the length of time it serves as resistance and the number of times it has been touched by price.The longer the period of time, the greater the strength of the line.Some traders will sell at resistance line.

Support Lines act like a floor and price areas where a currency pair finds it difficult to penetrate below the Support Line.Support lines are drawn through a previous se of lows and can either pause a downtrend or reverse it depending on the strength of the Support Line. Some trader buy at Support Line. All traders see the same thing.

Do not BUY close to RESISTANCE LINES Do not SELL Close to Support LINES

as there is a good change there will be a reversal


  • Trendlines are one of the most useful tools in trading. When you trade off trendlines you are trading off pure price action.
  • Trendlines are utilized to determine trend, momentum, support and resistance and reversals.
  • The steeper the slope the greater the momentum.
  • Trendlines are support and resistance.


Trendlines

It is impotant for traders to know which way the market is going, i.e is it trending up or down or even going sideway. Money can be made in all these condition, but it is important that traders "Trade with the Trend"

A trendline is a straightline that connect key prices areas in a move, an up trendline connects successive Higher Lows or Higher Highs and a down trendline connects successive Lower Highs or Lower Lows.Trendlines connecting successive Lower Highs is also known as a resistance line while a trendline connecting successive higher Lows is also known as a support line.

Trendlines can be defined as border lines for making buy or sell decisions.
A Trendline of about 45 degrees is considered the most reliable, and if steeper than that market typically cannot sustain that kind of momentum for long. Watch to see if the market bounces off a trendline or slices through. Watch for restest of trendline after the price has sliced through.You will often find good buying or selling points at the 3rd touch of a trendline.


Another nice review is here FFactory

Update:Some good article I found on jacko of forex factory thread.

Trading these lines can be very profitable, and you can do away with indicators if you follow a few simple rules...

1. The steeper the line the shorter it lasts, keep your stops tight if it moves away quickly. Keep your stops just above (resistance) or below (support) the line.

2. The price will always move back towards the support or resistance to test it, if there’s been a sizable move, wait for the consolidation to bring it back to the line, then trade.

2. You need at least three touches (or points in a line) to confirm that it is a support or resistance level. Two is not enough. If the price action moves away fast from the line connected by these points it’s probably the dying gasp, but don’t trade until you hit that line again.

3. A good way to choose an entry is to look for an established line and follow it up with sell orders a few pips below (support) or buy orders above the line (resistance) in the opposite direction.

4. If a “trend” is older and you're not sure if it's going to break or not, wait till you're on the line and then straddle it, that way you can get into an older move. I wouldn’t recommend this though; rather wait for a change in direction. Once you’re into the rhythm you’ll almost always have an open position.

5. If you’re not sure phase in your trades, add to your position every ten or twenty pips.

6. Breaks off support and resistance are generally confirmed by big bars or a big bar, so if you see one on a line you know the “trend” has probably changed.

7. Price does not like support or resistance levels. It mostly tests them and then moves away quickly. You’ll rarely find much price action in the vicinity of the line. If price is hanging around a support or resistance level, it’s likely to break in the opposite direction.

8. If the market is moving up you only trade the support line, if down you only trade the resistance line...

Monday, February 18, 2008

Double Bottoms and Double Tops

Double Bottoms and Double Tops

Double bottoms and tops are one of the most well known and powerful money making techniques known by forex trader. They are a test of a previous high or low. Triple Tops and Triple Bottoms are similar but have three Peaks and Lows.

The mirror image of the double top is the double bottom- a bullish formation. Support cannot be established until there is a test of the last point of support.
Double tops (M shaped) and double bottoms (W shaped) are stronger if the equal points are a long way apart. The two peaks of a double top do not have to be exactly at the same level so allow a few pips difference. A Double bottom with a slightly higher low for the second point can be a strong bullish signal. Double bottoms are not as strong in a strong downtrend as they are in an up trend.A double bottom which coincides with a pivot line can produce a fast move upwards.

A double top occurs when the price attempts to break out above a recent pivot but fails this pattern consists of two tops of approximately equal height. Many traders wait for the confirmation when the retracement low beneath the two peaks is broken to the downside after the second peak. when a double top has formed, the price objective is usually an equal distance down beyond the correction low ( valley between the two peaks). Double tops are not as strong up trend as they are in a down trend.


Double Bottom

Definition:

A double bottom occurs within the context of an existing bearish trend. It starts when a price reaches a low from which it sharply rebounds. The price then hits a high from which it rolls over. The price then falls back down to the previous low and rebounds for a second time, forming two equal lows. These lows are connected to form a horizontal support level. The resistance level is defined by the high formed after the initial rebound.

Nuance:

Double bottoms occur frequently within the context of bearish trends; therefore, it’s important to wait for confirmation before acting on a double bottom. Like 123 bottoms, double bottoms are ubiquitous. Many will form but ultimately fail over the course of a bearish trend. Anticipating confirmation is possible, but doing so requires acute risk management.

Double bottoms can form over very short periods and long periods of time.

Application:

A double bottom is confirmed once a price breaks above the horizontal resistance level ( Pivot High ). Entry points can be taken upon the breakout or after waiting for a retest of previous resistance and then buying on the bounce. A double bottom is rejected once a price breaks down below horizontal support.


Double Top

Definition:

A double top occurs within the context of an existing bullish trend. It starts when a price reaches a high from which it sharply reverses lower. The price then hits a lower from which it bounces higher. The price rebounds up to the previous high and reverses lower for a second time, forming two equal highs. These highs are connected to form a horizontal resistance level. The support level is defined by the low formed after the initial reversal lower.

Nuance:

Double tops occur frequently within the context of upward trends; therefore, it’s important to wait for confirmation before acting on a double top. Anticipating confirmation is possible, but doing so requires acute risk management. Double tops can form over very short and long periods of time.

Application:

A double top is confirmed once the price breaks below the horizontal support level. Entry points can be taken upon the breakdown or after waiting for a retest of previous support and then waiting for a rollover. A double top is rejected if a price breaks out above the horizontal resistance line.


Double Top Projection Technique or Double Bottom Projection Technique


123s Higher Lows and Lower Highs

123s Higher Lows and Lower Highs

This pattern can also be a continuation pattern, but at the top or bottom of a trend this pattern provides a good confirmation of direction change.The "3" point is a failed retest of previous High or Low. The failure of the test signifies the change from a bull market to a Bear market and vise versa. The "3" point can also be referred to as a higher Low or Lower High.This pattern is very usefull for finding a trade entry.

123 Bottom

Definition:

The 123 bottom is the most common bullish reversal pattern. The requirements for the 123 bottom are rather common, causing the pattern to frequently appear in existing bearish trends. Many 123 bottoms reach the first two conditions, but never confirm. The 123 bottom, therefore, can be somewhat deceiving. That’s why it’s imperative that the pattern confirms before placing trades.

The 123 bottom starts when a Forex sharply reverses higher after an extended bearish trend. This sharp rebound is the first requirement of the pattern, or part 1. The second requirement is for the price to halt its rally attempt at short-term resistance, which is part 2 of the pattern. Part 3 of the pattern forms when the price stages another sharp rebound, but from a relatively higher level than in part 1. The 123 bottom confirms when the price breaks above short-term resistance as defined in part 2.

Nuance:
A basic definition of a bearish trend is lower lows. A basic definition of a bullish trend is higher lows. The 123 bottom seeks to identify when a pattern of lower lows ends and a new pattern of higher lows begins.

Another way to think of a 123 bottom is as a very short-term cup and handle, only the 123 bottom occurs at the end of a bearish trend.

The 123 bottom occurs in most bearish trends, but it rarely confirms. When it does confirm, it’s best to take a very short-term approach to trading the 123 bottom. Taking profits quickly is generally a good idea after entering a 123 bottom.


123 Top

Definition:

The 123 top is the most common bearish reversal pattern. The requirements for the 123 top are rather common, causing the pattern to frequently appear in existing bearish trends. Many 123 top reach the first two conditions, but never confirm. The 123 top, therefore, can be somewhat deceiving. That’s why it’s imperative that the pattern confirms before placing trades.

The 123 top starts when a price sharply pulls back after an extended bullish trend. This sharp reversal is the first requirement of the pattern, or part 1. The second requirement is for the price to rebound from short-term support, which is part 2 of the pattern. Part 3 of the pattern forms when the price stages another sharp pullback, but from a relatively lower level than in part 1. The 123 top confirms when the price breaks below short-term support as defined in part 2.

Nuance:

A basic definition of a bullish trend is higher highs. A basic definition of a bearish trend is lower highs. The 123 top seeks to identify when a pattern of higher highs ends and a new pattern of lower highs begins.

Another way to think of a 123 top is as a very short-term double distribution, only the 123 top occurs at the end of a bullish trend.

The 123 top occurs in most bullish trends, but it rarely confirms. When it does confirm, it’s best to take a very short-term approach to trading the 123 top. Taking profits quickly is generally a good idea after entering a 123 top. Aside from the nature of the pattern, it’s also a good idea to take profits quickly so as to mitigate the risks that bearish traders face in the form of the long-term upward trend in Forex prices.

More over, you can download a system based on 1-2-3 Trading Signal

Thursday, February 7, 2008

Ascending and Descending Wedges

Ascending and Descending Wedges

Ascending Wedges in an uptrend-bearish

This pattern occurs when the slope of price candles highs and lows join at a point forming and inclining wedge. The slope of both lines is up with the lower line being steeper than the higher one. Place and order to breakdown and out of the wedge. The drop out of the wedge can be very dramatic.


( click to enlarge the image)


Descending Wedge in a downtrend-bullish

This formation occurs when the slope of price candle high and lows join a forming a declining wedge. The slope of both line is down with the upper line being steeper than the lower one. To trade this pattern, place an order on a break up and out of the wedge.


(Click to enlarge the image)

CHART PATTERNS

CHART PATTERNS


Chart Patterns are patterns which occur in trading charts that help traders predict the probable direction the currency pair is likely to move. Chart patterns may form over any time frame from a couple of hours to even years. Japanese candlestick patterns also provide a reliable insight as to where the immediate direction of the currency may head. Firstly we will look at chart pattern then then candlestick patterns. Sketches have been provide to illustrate the pattern and in a following section an number of real forex chart will be provide.

Patterns can be devided into two main categories (a) Reversal pattern where the market reverse it's direction and (b) Continuation patterns where markets continues in the same direction after a period of consolidation or retracement.

REVERSAL PATTERNS

Head and Shoulders/ Inverted Head and Shoulders
Ascending and Descending Wedges

123, Higher Lows, Lower Highs

Double Tops and Bottoms

Trend lines, Support and Resistance Lines

PIVOTs

Japanese Candlestick Patterns


CONTINUATION PATTERNS

Channels/ Rectangles
Flags and Pennants

Triangles

1234s, Higher Lows, Lower Highs


REVERSAL PATTERNS

Head and Shoulders

Head and Shoulder Patterns can be normal or Inverted. The normal head consists of three peaks where the center peak is the highest while the Inverted Head and Shoulder consists of three lows with center low the lowest. A necline is drawn through the lowest point either side of the head. A break through the necline provides a "sell opportunity" With the inverted head and shoulders the necline drawn through the top of the two peaks either side of the head. A break through the necline provides a "buy opportunity".


Japanese candle chart.


Please click on the Image to enlarge it and able to read How to set up a Head and Shoulder in trading. ( Source : www.trading-naked.com)


Please click on the Image to enlarge it and able to read How to set up a Head and Shoulder in trading. ( Source : www.trading-naked.com)


Please click on the Image to enlarge it and able to read How to set up a Head and Shoulder in trading. ( Source : www.trading-naked.com)


Please click on the Image to enlarge it and able to read How to set up a Head and Shoulder in trading.

Friday, January 18, 2008

The Power of Price Action

Let's talk about the different of price action ( PA ) and the system that using Lagging or Leading indicator.In my perspective, i find that both of this method are power full...only if they combine when to made a trade call.Couple years ago..i used purely price action to enter the market..such as pin bar, inside bar, outside bar, chart pattern like H&S or Inverted H&S combine with Fib R to put tp ( usually i put sl basicly by price action..meaning for example..when i find a good setup of a pin bar..then I'll put the sl on the nose +3 pips ). After year of using that methodology, i find it quit nice and generate some profit.But that's not the point..my aim is to have a comfort method..that result a good comparison of winning and losing trade (by quality and quantity). Like any other trader..i keep my self evolve..open to many new thing on this business. Then couple months ago, I find a system (..note it..find, not create).System that use many indicators, both lagging and leading indicator.Soon after that..after read it all over and over, I decide to try it..try it on demo first :P.Then I found that many times, just when the system show a good signal of trade..my price action tell me the opposite.And that quit annoying to me since I really don't know..should it test it pure by the system on demo and continue my live trade by price action or what..I cant get rid of my mind of price action setup each time that system show a signal.After having a bad time of result on demo..i don't give..that sometimes i found that the system tell me to short..my PA tell me not yet..still not confirmed by the price..or sometimes..and vice verse..But what make really happy is there is a time when both of them give a signal..and it usually a class A trade.Then I keep working on how to synchronize both of the method..It's a good combination..both of them filter out each other ( No method are give a 100% signal that end up with a profit ). For those who trade purely just by price action..i strongly suggest that u apply it to a system..u'll find it amazing.As for me now I'm comfort enough on my trading journey.BTW the system that using indicator that i mention above is EZ Forex system..hmm not want to be part of their marketing staff here, I change here and there but the core is basically from that system. LOL..as i write on my blog, the market vewwy vewwy quite..my bpjy profit by 2 pips and my UsJy -2 pips.Will wait the price..y'all know reward of patient right? :P.happy trade all

NB:any bad word or miss typo? forgive me my son :P..to lazy to check them again.

Pages